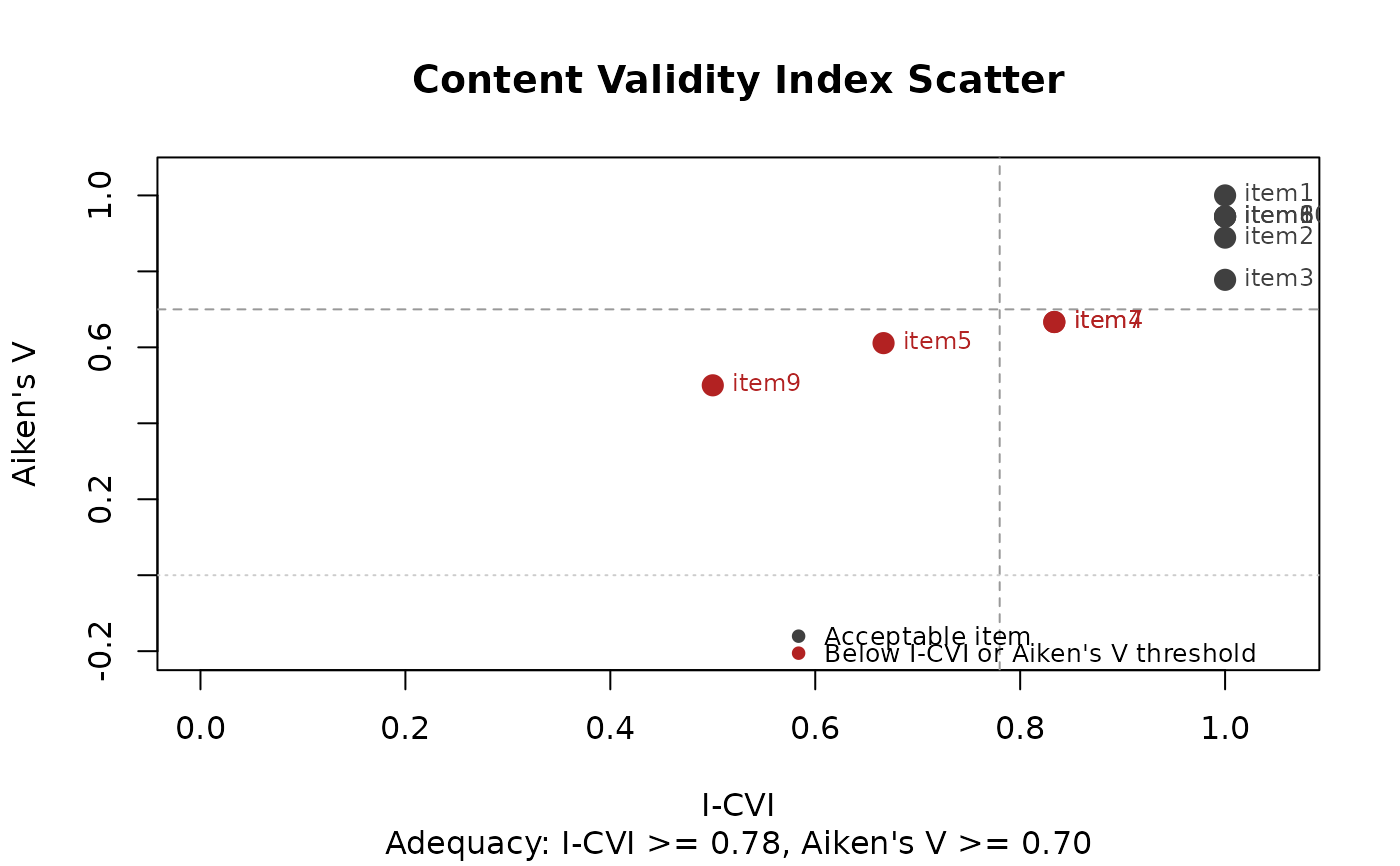
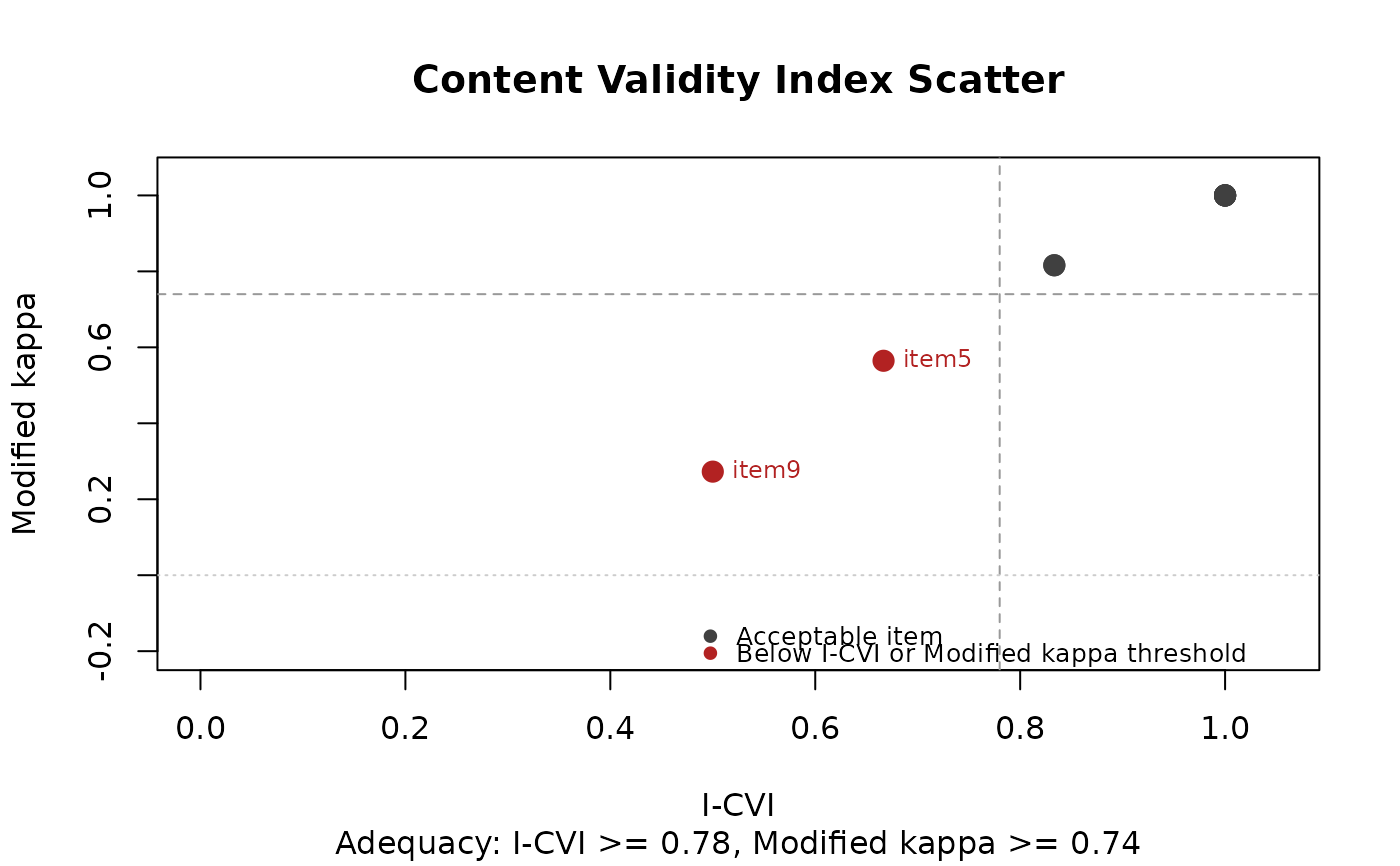
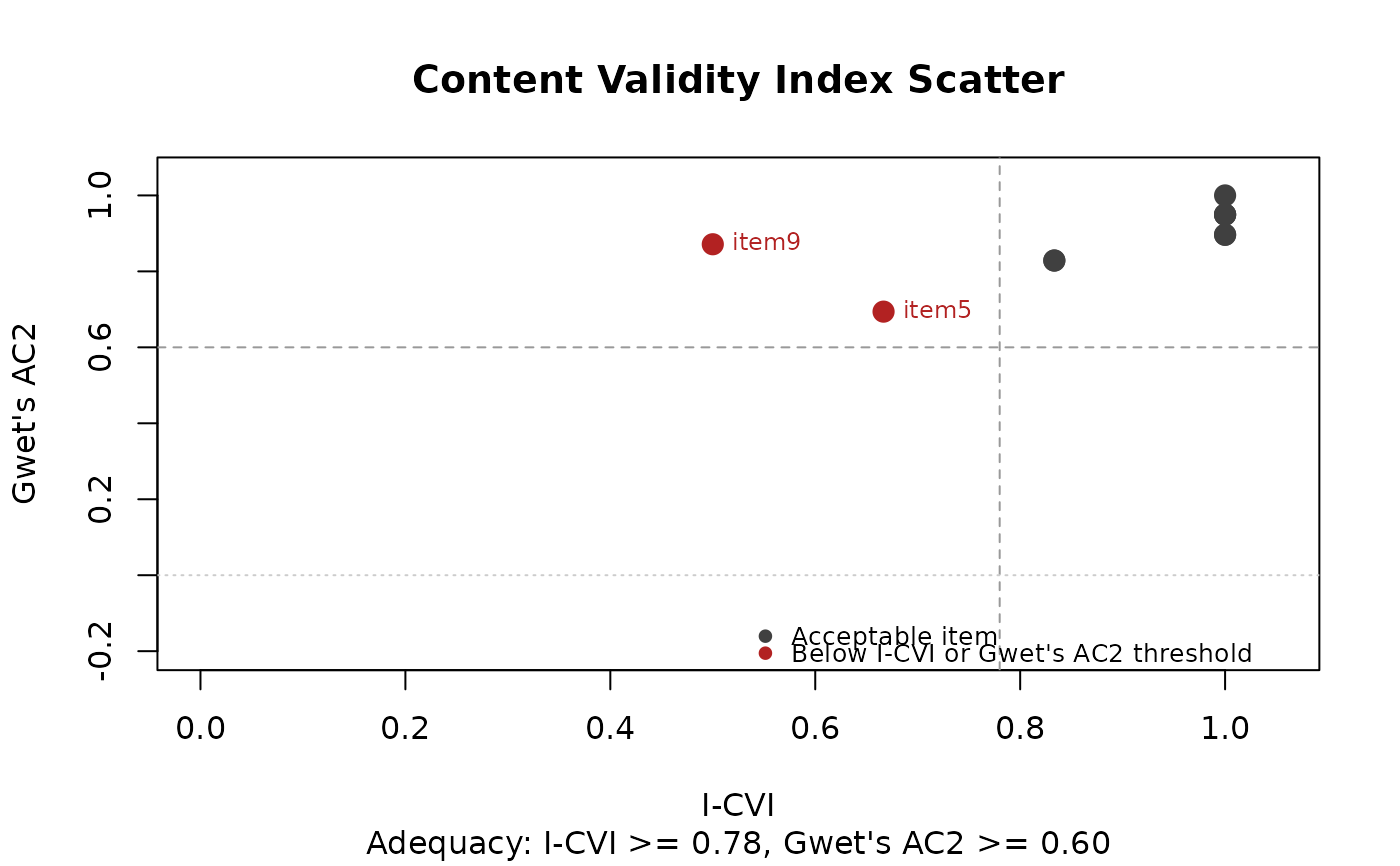
Produces an I-CVI / chance-corrected agreement scatter plot for the
item-level results of a content_validity() analysis, parallel to the
difficulty-discrimination scatter used in classical item analysis.
Items that fall outside the conventional adequacy region are flagged
in red and labeled by default.
Usage
# S3 method for class 'content_validity'
plot(
  x,
  y = NULL,
  y_index = c("mod_kappa", "gwet_ac1", "gwet_ac2", "aiken_v"),
  label = c("flagged", "all", "none"),
  flag_logic = c("any", "icvi", "y_index", "both"),
  flag_threshold_icvi = 0.78,
  flag_threshold_y = NULL,
  point_cex = 1.4,
  label_cex = 0.75,
  ...
)
Arguments
- x
A
content_validityobject returned bycontent_validity().- y
Ignored (required by the S3 plot generic).
- y_index
Character. Which agreement index to display on the y-axis. One of
"mod_kappa"(default),"gwet_ac1","gwet_ac2", or"aiken_v".- label
Character. One of
"flagged"(default, label only items outside the adequacy region),"all", or"none".- flag_logic
Character. Which axis (or axes) drive the flagging. One of
"any"(default; flag items below either threshold, useful for "items that need any review"),"icvi"(flag only items below the I-CVI threshold),"y_index"(flag only items below the y-axis threshold, useful when the plot is presenting one index specifically), or"both"(strict; flag only items below both thresholds).- flag_threshold_icvi
Numeric. Lower I-CVI threshold marking the adequacy region (Polit & Beck, 2006). Defaults to 0.78.
- flag_threshold_y
Numeric. Lower threshold on the y-axis index. Defaults depend on
y_index: 0.74 for mod_kappa (Cicchetti & Sparrow, 1981), 0.60 for AC1 and AC2 (Altman, 1991), 0.70 for Aiken's V (Aiken, 1985).- point_cex
Numeric. Point expansion factor. Default 1.4.
- label_cex
Numeric. Label expansion factor. Default 0.75.
- ...
Currently ignored.
Value
Invisibly returns x. Called for its side effect (a base R
plot drawn on the current graphics device).
References
Aiken, L. R. (1985). Three coefficients for analyzing the reliability and validity of ratings. Educational and Psychological Measurement, 45(1), 131-142. doi:10.1177/0013164485451012
Altman, D. G. (1991). Practical statistics for medical research. Chapman and Hall.
Cicchetti, D. V., & Sparrow, S. A. (1981). Developing criteria for establishing interrater reliability of specific items. American Journal of Mental Deficiency, 86(2), 127-137.
Polit, D. F., & Beck, C. T. (2006). The content validity index: Are you sure you know what's being reported? Research in Nursing & Health, 29(5), 489-497. doi:10.1002/nur.20147
Examples
data(cvi_example)
result <- content_validity(cvi_example)
plot(result)
 plot(result, y_index = "gwet_ac2")
 plot(result, y_index = "aiken_v", label = "all")